Sales Commission Rates by Industry
Pay mix matters more than the headline rate when evaluating total compensation.

A commission rate in isolation tells you very little. The ratio of base salary to variable pay, the pay mix, determines how much weight that rate actually carries in a rep's total compensation picture. Two reps at identical OTEs, one on a 50/50 split and one on a 70/30, are living inside fundamentally different incentive structures even if the headline commission percentage is the same.
The split signals something concrete about where the company believes the rep's influence begins and ends. A heavily variable plan reflects a judgment that the rep's individual skill, effort, and judgment drive the outcome. A more base-heavy plan reflects the opposite: that brand, inbound demand, institutional relationships, or a short and simple sales process does most of the revenue-generating work, and the rep is executing within a structure rather than creating outcomes from scratch.
Role-based variation within a single company follows logically from this. SDRs and BDRs carry more base because their output, pipeline and qualified meetings, sits several steps removed from closed revenue; tying their comp too tightly to eventual deal close would introduce noise that has nothing to do with their performance. Account executives and enterprise reps carry more variable because their decisions, which accounts to prioritize, how to run a deal, when to escalate, materially affect whether a contract closes and at what value. Account managers on renewals typically sit between those two poles: renewal risk is lower in a healthy book of business, and the rep's influence, while real, is less determinative than in a new logo pursuit.
OTE functions as the primary planning anchor, but only makes sense alongside the quota-to-OTE multiple. A plan where the commission rate mathematically requires a rep to close five times their OTE in revenue just to earn their variable target will underpay most of the team, regardless of how competitive the rate looks in isolation. Flat rates versus tiered structures compound this further: two plans with the same average rate at quota will produce materially different payouts at underattainment and overattainment. The structure of the plan shapes behavior as much as the rate itself does.
SaaS and technology: tiered incentives and the quota attainment gap
SaaS commission economics are grounded in recurring revenue logic. A closed deal's value compounds through renewals and expansion over the life of a contract, so the initial commission rate reflects a slice of a long-term revenue relationship rather than a single transaction. This partially explains why SaaS base commission rates for account executives at quota attainment cluster in a moderate range; the real compensation differentiation happens above quota, where well-designed plans deploy accelerators that substantially increase the effective rate on incremental revenue.
The Bridge Group's 2024 SaaS AE Metrics and Compensation Benchmark Report places the median quota-to-OTE multiple at approximately four to one. A rep earning a $100,000 variable component at quota is expected to close $400,000 in revenue at that multiple. The commission rate is simply the arithmetic output of that relationship, not an input the designer sets independently.
The quota attainment gap is the most persistently misunderstood feature of SaaS comp design. A large majority of SaaS sellers miss quota in any given year, which means the OTE figure that appears in offer letters is a ceiling most reps do not reach. Plans designed around on-target attainment as though it were a median outcome systematically misrepresent expected earnings, creating recruiting friction and a trust deficit that widens every quarter reality diverges from projection.
Role differentiation within SaaS follows a clear hierarchy. New logo account executives carry the highest commission rates and the most aggressive accelerators, because hunting capacity is genuinely scarce and the rep's contribution to a new logo win is direct and measurable. Account managers on expansion work shorter cycles against existing relationships, which justifies a lower rate than new logo even when the contract value is comparable. Renewals are frequently paid at reduced rates or excluded from commission entirely in businesses where renewal risk is demonstrably low and rep influence over the outcome is marginal.
Gartner's 2024 research finding that sales organizations simplifying seller roles are dramatically more likely to be top performers carries a direct implication for SaaS plan design. Stacking SPIFs on top of accelerators on top of product-line kickers creates calculation complexity that reps cannot quickly translate into a personal earnings estimate, and an incentive a rep cannot mentally model in real time does not function as an incentive. As enterprise SaaS deal cycles have lengthened and average contract values have grown, some organizations have responded by moving toward milestone-based or multi-stage commission triggers rather than single close-date payouts, which distributes risk more equitably across a cycle that can span many months.
Financial services and real estate: high rates justified by high margins and high stakes
Financial services and real estate carry some of the highest commission rates visible in any industry benchmark, and the reason is not cultural convention. The margins available on large-ticket financial products and property transactions are large enough to absorb a higher percentage payout without destroying unit economics, which is the only reason those rates are sustainable.
Real estate commission structures require a specific clarification. The gross rate on a transaction is split among multiple parties: listing agent, buyer's agent, and their respective brokerages. The headline rate on any given listing bears little relationship to what an individual agent nets, and benchmarks that cite gross transaction rates without accounting for those splits produce a systematically inflated picture of individual earnings.
Within financial services, the variation by sub-sector is substantial. Wealth management and investment products carry higher rates, reflecting the long-term value of client relationships and the complexity of a sale that involves regulatory suitability analysis, risk profiling, and often a multi-month discovery process. Insurance commission structures vary sharply by product type: life and specialty products command higher rates than commodity property-and-casualty lines, where pricing has become increasingly automated and the rep's advisory contribution is narrower. Consumer banking and lending products face the most compressed rates in the sector, partly because margins are tighter and partly because regulatory scrutiny of incentive structures in consumer financial products has intensified over the past decade.
Clawback provisions in financial services are more elaborate and more legally codified than in most other sectors. Chargebacks on canceled or lapsed insurance policies are standard practice, and regulatory frameworks in certain product categories establish explicit expectations for recoupment mechanisms. A company moving from financial services comp design into another sector, or vice versa, should treat its clawback architecture as sector-specific rather than portable.
The benchmarking implication is direct: a financial services firm comparing its commission rates to SaaS medians is comparing businesses with structurally incompatible unit economics, sales cycle geometries, and regulatory environments. The right peer group is as important as the right metric.
Manufacturing, industrial, and retail: low rates, high volume, and the role of channel structure
Manufacturing and industrial sales operate inside a margin envelope that is a fraction of SaaS or financial services, and the commission rate has to fit within a unit economics constraint that also accommodates cost of goods, logistics overhead, and distribution costs. Low absolute rates in this sector are not a sign of undervaluing the sales function; they are an arithmetic necessity given the margin structure.
Specialty segments within manufacturing, such as heavy machinery, custom industrial solutions, or highly engineered components, justify higher rates because the sale genuinely requires deep technical expertise, extended relationship cycles, and the kind of consultative engagement that takes years to develop. A rep who can spec a custom hydraulic system for a refinery client and navigate a procurement process spanning multiple stakeholders and a twelve-month timeline is providing a fundamentally different service than one processing reorder transactions through an established distribution channel.
Channel dynamics are the most commonly overlooked variable in manufacturing benchmarks. Many manufacturers sell through distributors or independent manufacturers' representatives rather than direct sales forces. The commission paid to a channel partner is a fundamentally different calculation from a direct rep's commission: it incorporates margin-sharing economics, territory exclusivity, and often a negotiated percentage of the manufacturer's price rather than a percentage of end-customer value. Conflating the two in a benchmark produces numbers that serve neither comparison well.
Retail represents the most compressed segment of the broader commission landscape. Consumer goods margins are thin, transaction sizes are small, and volume drives revenue. Commission structures at retail function as a small variable supplement to a base or hourly wage rather than as the primary income component. Product-specific SPIFs, margin-based bonuses, and volume incentives do more behavioral work in manufacturing and retail than rate adjustments do, because the rate is constrained below the level where small changes produce meaningful behavioral signals.
How role within the sales cycle changes the rate, regardless of industry
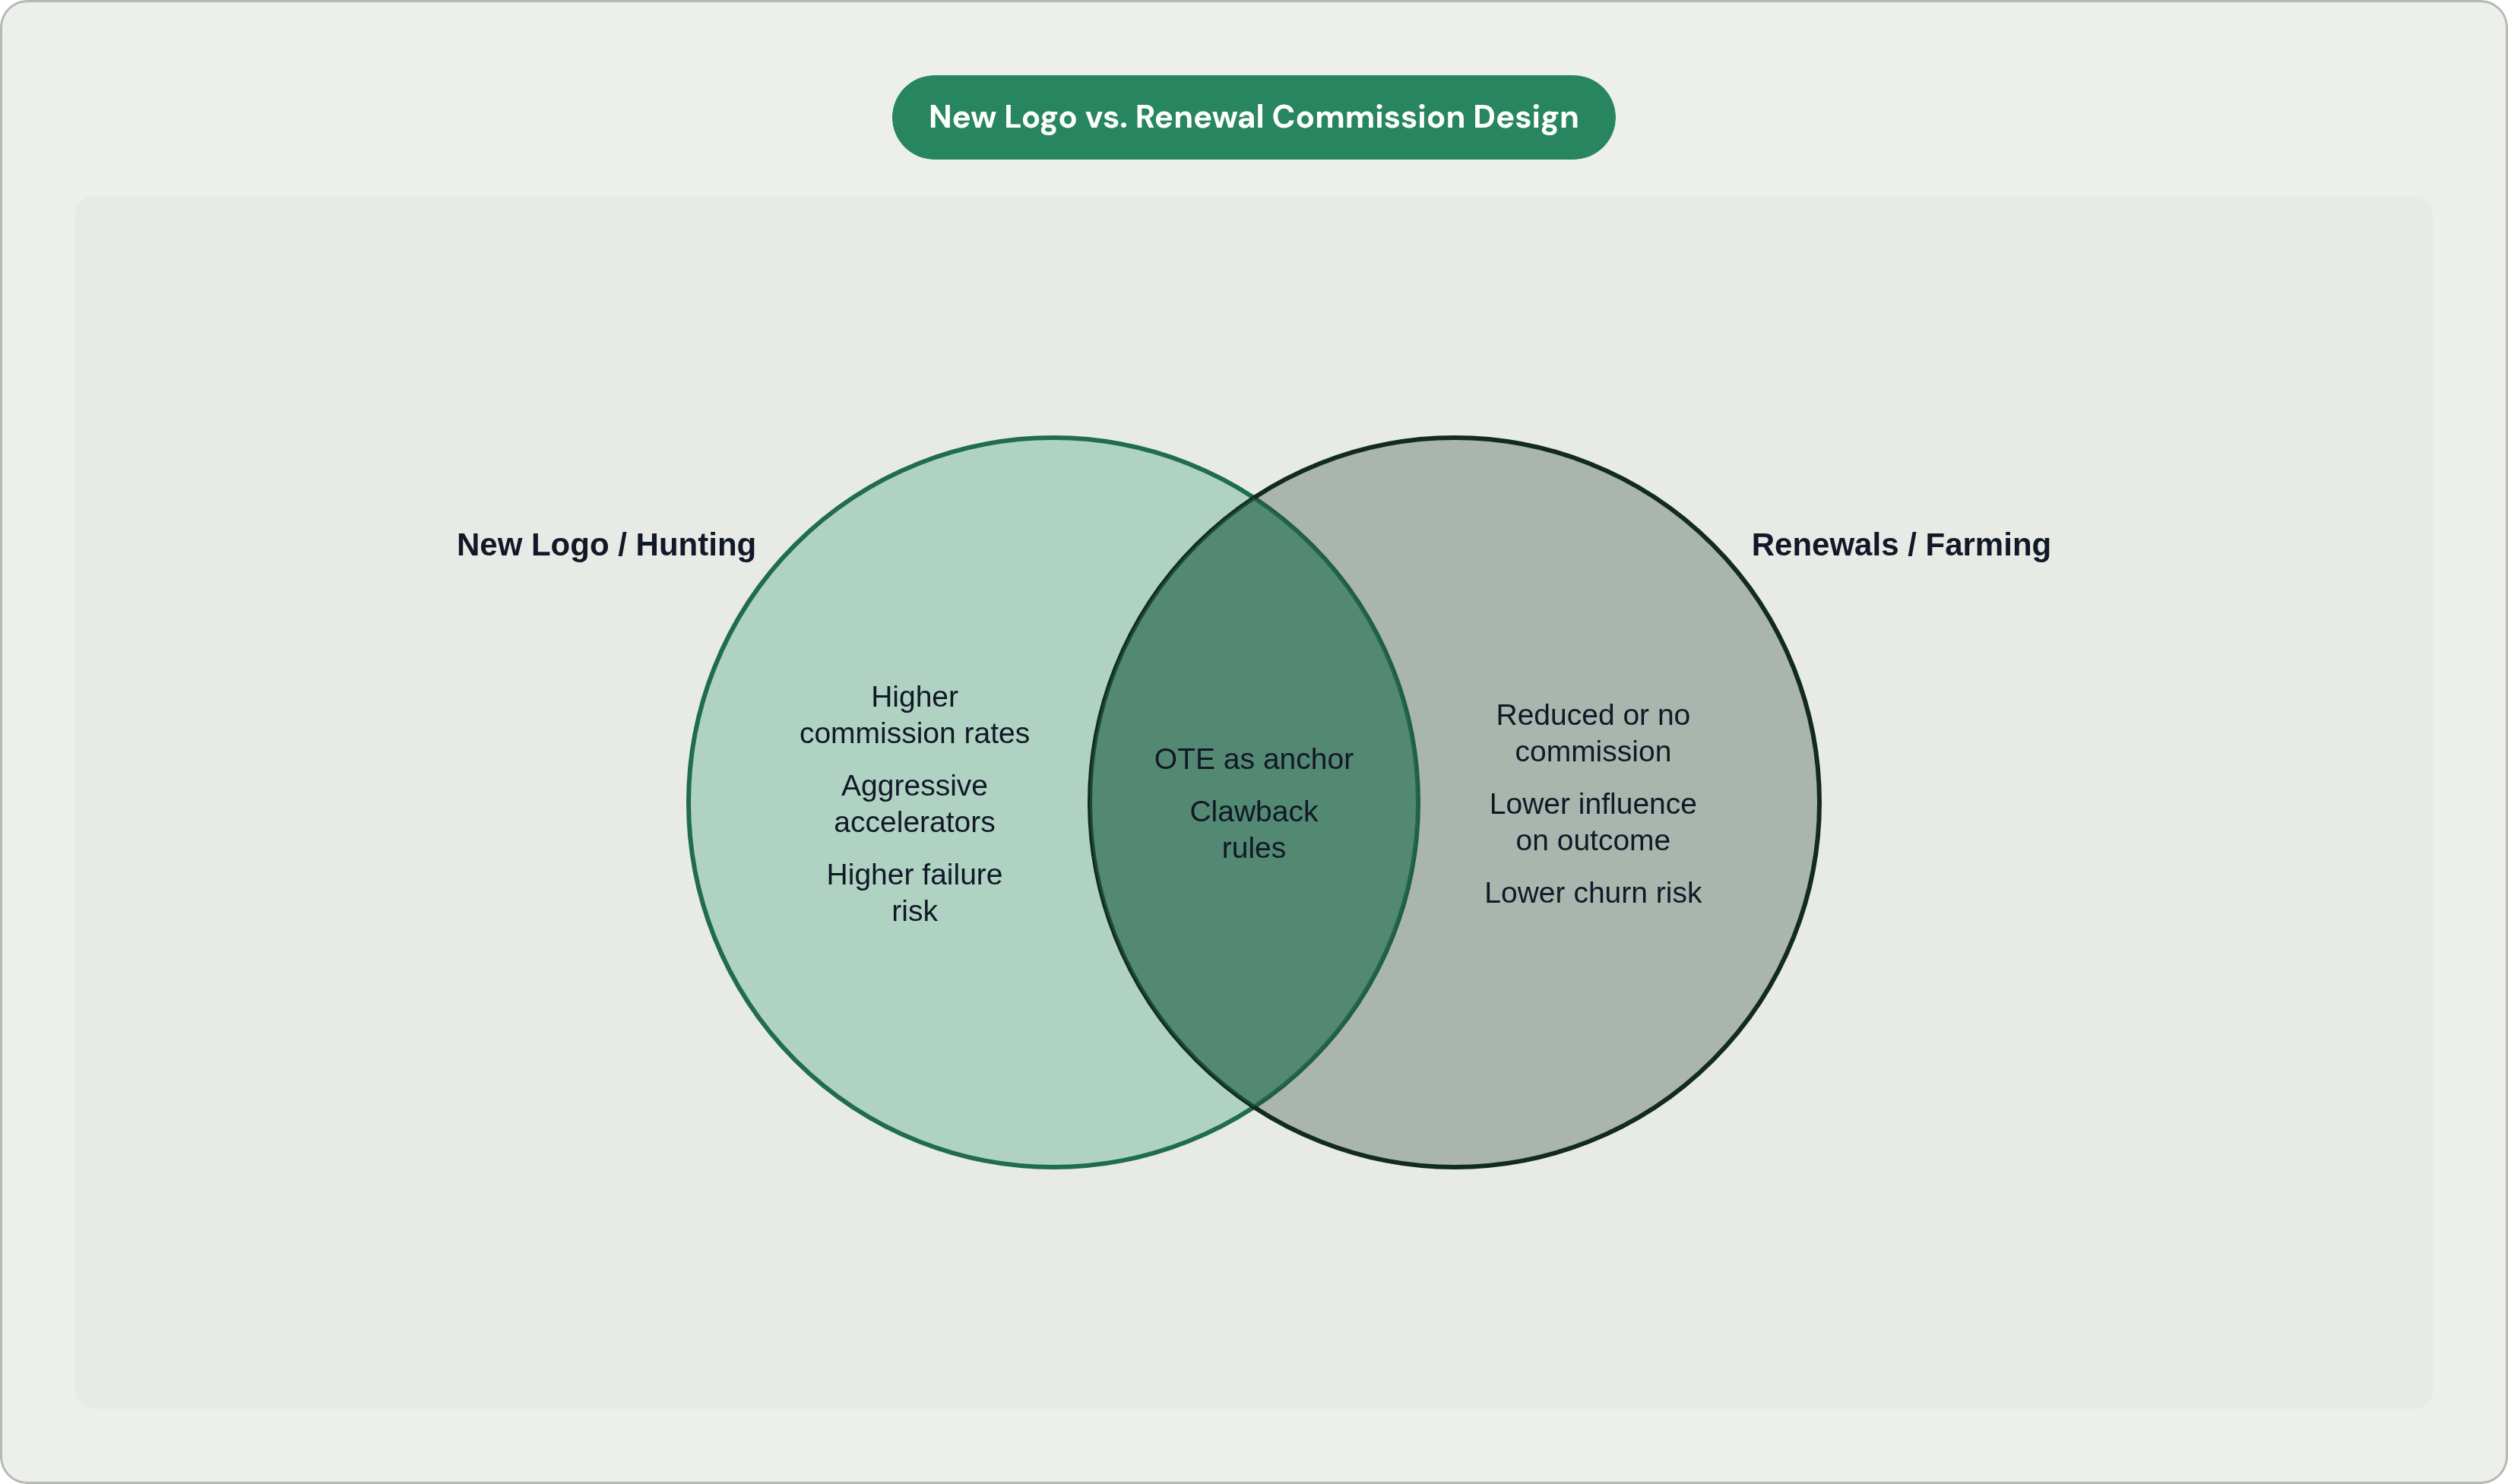
Across every sector covered here, two factors determine whether a higher or lower rate is appropriate for a given role: how directly the rep's effort drives the outcome, and how much risk the rep bears that the revenue will actually materialize.
The hunter-versus-farmer distinction holds across industries. New business acquisition commands higher rates than account management or renewals in SaaS, financial services, manufacturing, and retail alike, because the effort required to identify, develop, and close a new relationship is greater, the risk of failure is higher, and the rep's contribution to the outcome is more singular.
Renewal commission design is one of the more consequential decisions a comp team makes and one of the least carefully reasoned in most organizations. Paying the same rate on a renewal as on a new logo overpays for revenue that would have renewed regardless of the rep's effort; paying nothing on renewals creates an explicit incentive to neglect existing accounts. The appropriate rate should be grounded in actual churn data, because a business with 95% gross retention faces a different renewal commission problem than one operating at 80%.
SDR and BDR comp design follows from the same logic. Because pipeline generation is several steps removed from closed revenue, most SDR plans pay a combination of activity-based bonuses and small commissions on qualified meetings or opportunities created, rather than a percentage of eventual deal value. This reflects an honest accounting of what the SDR controls and what they do not.
Enterprise and SMB reps within the same company require structurally distinct plans, even when their OTEs are similar. An enterprise rep managing a handful of large accounts through long cycles with multiple stakeholders needs a rate, quota, and pay mix calibrated to that motion; an SMB rep closing many smaller deals per month in a transactional environment needs a different structure entirely. Applying one template to both produces a plan that fits neither role adequately.
Management override structures, which pay sales managers a small percentage on their team's production, appear most frequently in insurance and financial services and raise a distinct set of design questions around team size and span of control. As team size grows, even a small override rate can produce a management compensation that drifts significantly from what the plan intended to pay.
What the economics behind your rate imply for plan structure
The commission rate is an output of plan design, not a starting point. The defensible sequence is to define the business goal the plan should drive, model the unit economics that bound what is payable, and then set the rate and structure that produces the target behavior within those constraints. Working backward from a benchmark rate to a quota, or forward from a desired OTE to a rate without modeling the underlying margin, skips the steps that make the output coherent.
Alignment between structure and business priority is where most plans fail. A company prioritizing new customer acquisition should build in accelerators above quota, potentially a differentiated rate for new logo versus expansion, and SPIFs on specific segments or product lines where strategic growth is concentrated. A company prioritizing margin improvement should build commission structures that penalize heavy discounting or reward deals closed at or above list price, because a flat rate on revenue regardless of margin gives reps no financial reason to protect pricing. A company prioritizing account expansion needs to commission net new revenue within existing accounts specifically, not just total renewal value.
The flat-rate versus tiered-rate decision deserves more deliberation than it typically receives. Flat rates are easier for reps to understand in real time and for finance to calculate accurately; that administrative clarity is worth more than most organizations account for when designing plans. Tiered structures differentiate between performers more precisely and concentrate earnings upside with the people generating the most revenue, but they introduce bracket complexity, the risk of applying the wrong rate to the wrong portion of a deal, and the possibility that reps manage their pipeline timing to optimize tier placement rather than close dates.
Clawback provisions require specificity: the recovery window, the triggering events, the mechanism for recoupment, and the treatment of partial periods. Vague clawback language invites disputes and, in states with strict wage deduction statutes, creates legal exposure that exceeds the value of the commissions being recovered. Quota-setting discipline compounds the rate question: a well-calibrated rate on a structurally flawed quota produces bad outcomes regardless of how thoughtfully the rate was derived.
Gartner's finding on simplification applies here with particular force. Every tier, kicker, or exception added to a plan should clear a demonstrable bar: does it produce a behavioral change that can be observed and attributed? An incentive element that reps cannot quickly translate into a personal earnings estimate in the moment of a decision does not affect that decision.
Where manual commission processes break down at scale
The plans described above, with their tiered rates, accelerators, role-based splits, clawbacks, and data drawn from multiple systems, are precisely the structures that expose the structural limits of spreadsheet-based commission management. A large majority of small and midsize businesses still manage commissions in spreadsheets, per Commissionly's 2025 Benchmark Report; this sits in mounting tension with the complexity that even modest sales organizations routinely carry.
The failure modes are specific and recurring. Tiered rate application in manual spreadsheets routinely produces systematic overpayment because the higher accelerator rate gets applied to the full deal value rather than only to the portion above the attainment threshold. The math looks plausible; the output is wrong. When deal records, close dates, and contract values live in a CRM and commission logic lives in a separate spreadsheet, mismatches accumulate through currency formatting differences, date interpretation errors, and version lag between systems. Clawback tracking requires someone to remember, 60 or 90 days after close, to reverse a commission on a deal that canceled, and spreadsheets have no native mechanism to flag, enforce, or even surface that obligation automatically.
The audit trail problem is less visible until a dispute arises. A spreadsheet modified by multiple administrators over a quarter has no reliable version history, and when a rep challenges a payout, there is no authoritative record of what logic was applied at the time of calculation. That gap is both an operational problem and, in states where earned commissions are treated as wages under wage-and-hour law, a legal one: the inability to produce the version of a plan in effect on a specific transaction date is a meaningful liability.
ASC 340-40, issued alongside ASC 606, requires that commission payments tied to obtaining a customer contract be capitalized and amortized over the expected benefit period, with a schedule auditors can reproduce. Manual processes routinely produce findings on this requirement during audit, and remediation after the fact is expensive. These are not edge-case failures; they are the predictable outputs of applying manual tools to non-trivial plan structures.
What commission software actually changes about the calculation and approval workflow
The core change commission software delivers is structural: the commission logic, rates, tiers, accelerators, clawback rules, and role-based splits, lives in a system rather than in a spreadsheet that someone owns and everyone modifies. That shift has downstream consequences throughout the calculation and approval process.
Calculation accuracy improves not because software is inherently smarter than a well-built spreadsheet, but because the rules are defined once, validated against the plan document, and applied consistently to every transaction without manual intervention. Tiered rate application, the error that appears most often in spreadsheet audits, becomes a configuration decision rather than a formula that someone has to rewrite correctly for each pay period. When a deal record updates in the CRM, the commission calculation updates with it, rather than waiting for someone to manually pull a data export, reconcile it against the prior version, and re-run the math.
Platforms like Performio, Xactly, Everstage, Incentivesmart, and Commissionly approach this differently in terms of where they sit in a company's tech stack, how they handle CRM integration, and what level of plan complexity they are designed to support, but the shared function is the same: moving the logic out of a file and into an auditable system of record. For a finance or RevOps team managing more than a few dozen reps with differentiated plans, that shift recaptures a substantial amount of administrative time and eliminates an entire category of dispute.
The approval workflow change is equally significant, though less obvious before an organization has lived through a contested payout. When commission calculations run through a defined system, each payout carries a traceable record: what data fed the calculation, what rules were applied, what the output was, and who reviewed and approved it. That trail is what allows a company to respond to a rep's dispute with a factual answer rather than a reconstructed argument, and it is what allows an auditor or a legal proceeding to establish what plan was in effect on a specific date. The absence of that trail is, in retrospect, the most consequential cost of spreadsheet-based management, and it is the one organizations rarely quantify until it produces an actual loss.