Sales Compensation Benchmarking Tools for B2B Revenue Teams
Comparing five benchmark sources reveals which data actually fits your role, segment, and stage.

A benchmark is a number that answers a narrow question about a specific group of people, collected a specific way, at a specific moment. Most revenue teams skip that whole chain of qualifiers. They see "$195K OTE for a SaaS AE," match it to a job title on their org chart, and drop it straight into a comp plan without asking who was surveyed or when. That's the gap this piece is trying to close: benchmarking tools only pay off once a team understands what each source actually measures, how those numbers hold up (or don't) across role and segment, and how to turn a reference point into a plan that survives contact with a quota. As Optymyze puts it, the operating principle is to triangulate before committing, because no single source covers every segment, industry, or company stage.
The five benchmark sources B2B revenue teams use and what each one measures
RepVue runs on volume. It pulls self-reported comp data from a large population of reps, which gives it stable medians at the role level and numbers that update more or less continuously. The tradeoff is coverage: the platform's user base skews toward tech and SaaS, and self-reported pay always carries some social-desirability bias, meaning reps rounding up rather than down. Used well, RepVue is a solid check on AE and SDR OTE at the individual-contributor level. Used badly, it's treated as gospel for roles and industries where the sample barely exists.
Bridge Group works differently. Its surveys run annually and go directly to compensation leaders at B2B SaaS companies, not to individual reps, and the most recent (2026) edition covered 158 B2B companies. That specificity is why Bridge Group's data functions as something close to a gold standard for SaaS AE comp: the sample is narrow, but it's narrow in exactly the direction most SaaS comp planners need. Its real strength is quota-to-OTE ratios and commission-rate norms, the kind of structural detail that a rep-reported platform can't reliably surface.
Talentfoot sits at the opposite end of the org chart. Its data comes out of executive search work, meaning candidate and client pools skewed toward senior leadership hires, including the most senior sales executive roles. That makes it one of the few decent sources for senior leadership benchmarks, a population that both RepVue and Bridge Group cover thinly, if at all.
WorldatWork takes the broadest possible view: a cross-industry association survey that says less about any single role's OTE and more about how plans are built. Its data is where accelerator norms come from, and the standard finding is that accelerator rates typically run 1.5x to 2x the standard commission rate once a rep clears quota. It's the right source for questions about caps, accelerators, and SPIFF structure, not for pinning down what a mid-market AE should earn.
Pavilion, a membership network of go-to-market leaders, published its 2025 GTM Compensation Benchmarks off a base of more than 1,200 go-to-market leaders. That gives it particular strength in growth-stage company data and senior-leader ranges, VP and CRO comp especially, areas where general-population platforms thin out fast.
None of these five sources covers every role well on its own. A rep-level platform will underrepresent CROs; an executive search firm's numbers say almost nothing about SDR pay mix. Build a simple matrix: which source for which role, which source for which segment, before a single number gets pulled and dropped into a spreadsheet. When two sources agree, that's a signal to trust. When they diverge by a wide margin, that gap is information too, not noise to average away.
What the 2025–2026 benchmarks show by role and segment
The following are figures for a specific country's market. medians. Company stage, industry, and geography all move these ranges, sometimes substantially, so treat them as a starting point rather than a target to hit exactly.
SDR and BDR roles are around $85K in OTE per RepVue's data, with pay mix skewed heavily toward base, typically 70/30. That mix makes sense given the job: SDRs get paid against activity metrics, not against closed revenue, so a big variable swing tied to something they don't fully control would just create noise.
General SaaS Account Executives are around $195K OTE per RepVue's numbers, split roughly 50/50 between base and variable. The quota sitting under that OTE typically runs 4x to 6x for closing AEs in B2B SaaS, a ratio that's held steady since 2022 according to industry trackers. Moving down to mid-market, OTE ranges from $160K to $220K on the same 50/50 mix, with comp having climbed roughly 6 to 9 percent from 2024 to 2026, outpacing general wage growth. Enterprise AEs sit higher still, $230K to $270K or more, with The Quota's 2025 Sales Salary Guide putting the median right around $255K. Pay mix at the enterprise tier holds mostly at 50/50, though some sources show a slow drift toward 55/45 as boards push for more performance leverage in the plan.
Sales Engineers earn around $200K OTE on a much heavier base, typically 70/30, which reflects the role's technical, supporting function rather than a direct revenue-closing responsibility. Their quota, where one exists at all, is usually team-based or pooled rather than tied to individual bookings. Customer Success Managers who carry a renewal quota run an even heavier base skew, around 80/20, because retention and net revenue retention outcomes are harder to attribute cleanly to one person's effort. First-line Sales Managers are in a wide range, $200K to $370K with a median near $280K per RepVue's data, on a 60/40 mix built around team rollup performance.
Senior leadership numbers get murkier fast. Talentfoot's 2026 study and Pavilion's 2025 GTM Compensation Benchmarks both show VP and CRO OTE climbing well above the AE tiers, particularly at growth-stage companies. Equity often makes up the larger share of total comp at this level, so a headline OTE number alone tells an incomplete story about what a VP of Sales or CRO is actually being paid to stay.
On commission rates specifically, the Bridge Group's SaaS AE Compensation Report puts the typical rate in the low teens as a percentage of bookings at full attainment. WorldatWork's accelerator data backs up the 1.5x to 2x multiple once reps clear quota, and the ICONIQ Sales Compensation Report frames a healthy quota-to-OTE ratio as falling between 5x and 9x. Geography adds another layer: roughly 40 percent of B2B SaaS employers use a single national OTE figure, while the other 60 percent split pay into two to four geographic zones. RevOps and Sales Ops professionals with AI fluency now command a 5 to 12 percent premium over standard benchmark tiers, a fast-moving detail worth tracking separately from core sales roles.
The biggest source of distortion, though, is industry itself. Optymyze's research shows the same job title can carry substantial OTE variance, sector to sector, easily large enough to make a benchmark pulled from the wrong industry actively misleading rather than just imprecise.
How quota design shapes whether a benchmark number is useful
OTE by itself is close to meaningless. A comp plan motivates anyone based on the ratio between that OTE and the quota sitting underneath it, because that ratio is what turns a headline pay number into a real incentive or, if it's set wrong, a source of quiet resentment.
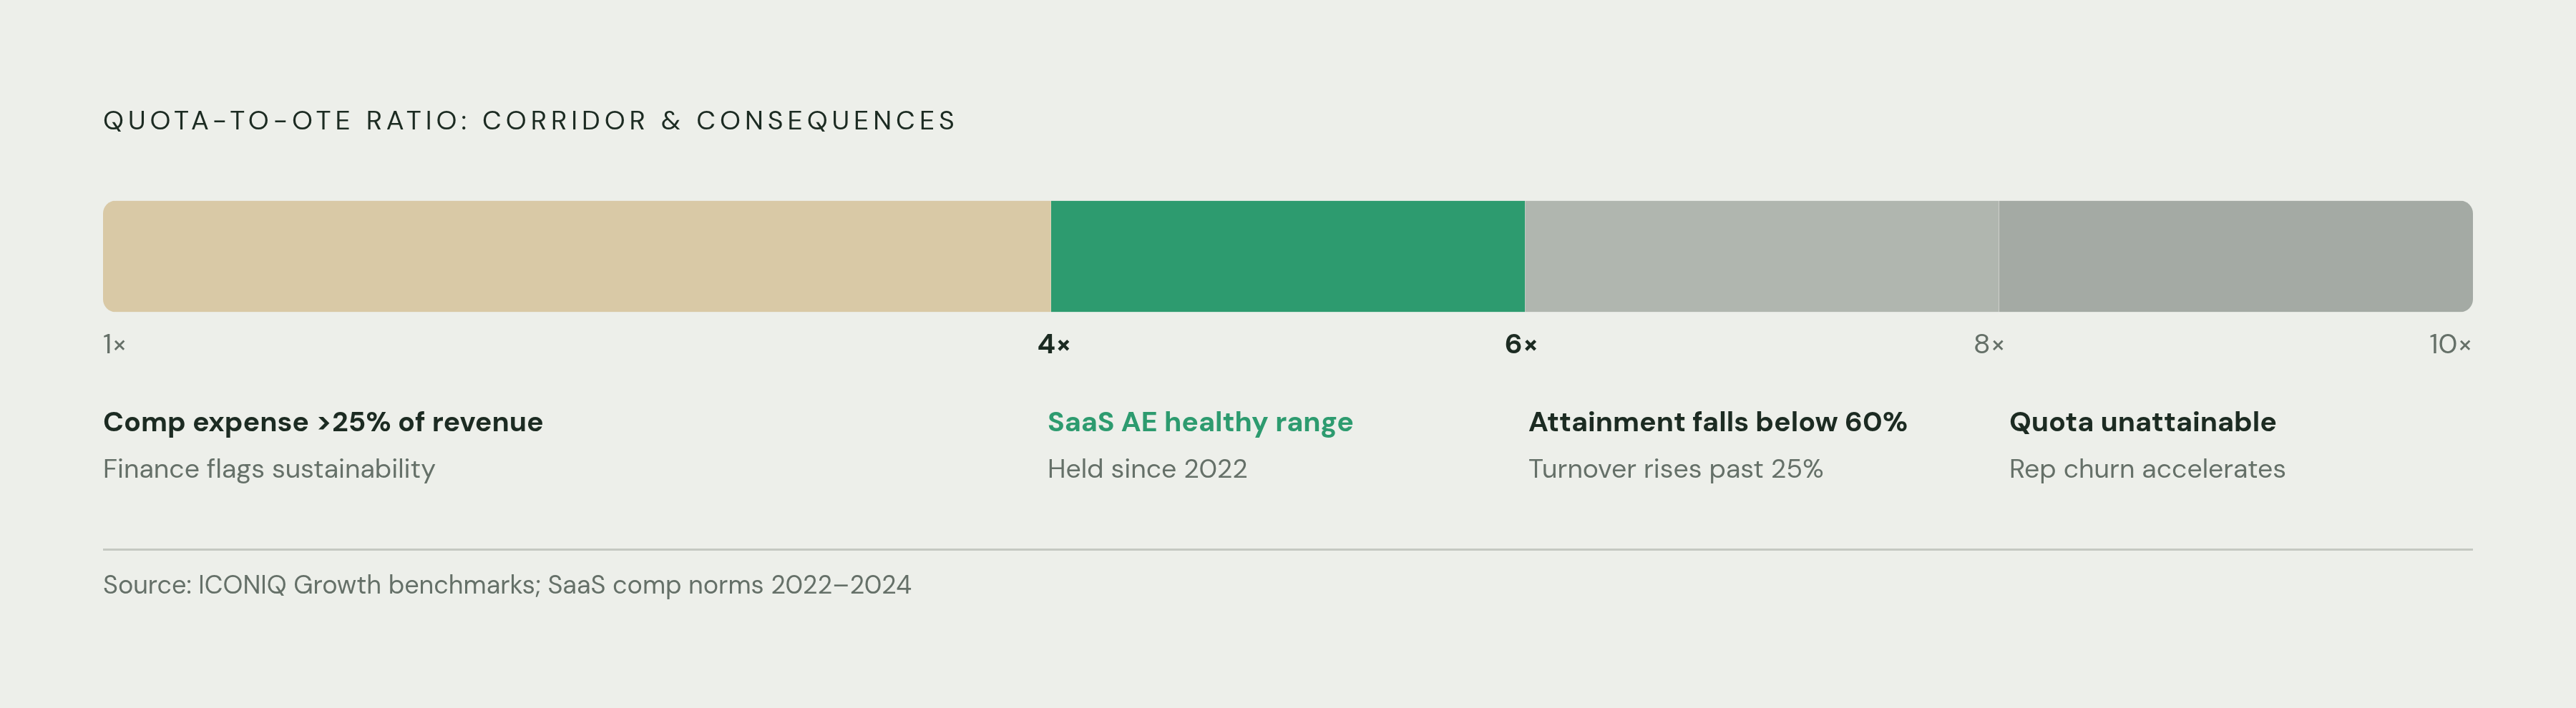
The ICONIQ Sales Compensation Report frames the healthy range as 5x to 9x quota-to-OTE, and industry data points to a steadier 4x to 6x range for closing AEs in B2B SaaS, a multiple that's held since 2022. Push that multiple above 7x or 8x, and attainment rates typically fall below 60 percent while turnover climbs past 25 percent. Pushing it below 4x raises comp expense as a share of revenue above 25 percent, the point where finance starts asking hard questions about the plan's sustainability.
Attainment distribution matters just as much as the multiple. Fullcast's Benchmarks Report found that even after companies lowered quotas, nearly 77 percent of sellers still missed their number. Salesforce's State of Sales, sixth edition, reported 67 percent of reps expected to fall short of quota in the survey year, and 84 percent actually missed in 2023. A benchmark OTE paired with a quota that most of the team can't hit doesn't produce the motivation the plan was designed around; it produces quiet erosion of trust, one missed quarter at a time.
Best practice is designing quotas so that 60 to 80 percent of the team hits them. Benchmark OTE figures are calibrated against that assumption. Setting a quota well outside that band, too easy or too hard, causes the benchmark number to stop meaning what it's supposed to mean.
Total sales cost, as a share of new revenue generated, should run roughly 15 to 25 percent. Companies whose comp-to-revenue ratio sits above 18 percent past the $50M ARR mark usually aren't looking at a compensation problem so much as a sales-efficiency problem that comp happens to be exposing.
Translating benchmarks into a compensation plan that reps and finance both trust
A benchmark is a reference point. Plan design still has to layer in what's specific to the business: its growth stage, its margin structure, its actual historical attainment data, none of which any external survey can supply.
The build order matters. Business goals and measurable KPIs come first, because benchmarks should constrain plan design, not dictate it outright. From there, OTE and pay mix get chosen using the role and segment data covered earlier, and quota gets set using the multiple guardrails, 5x to 9x per ICONIQ, 4x to 6x for SaaS AEs specifically, targeting that 60 to 80 percent attainment band. Only after those pieces are in place does commission rate get calculated, and it should come from dividing target variable pay by sales at quota.
Real plans get more complicated than that base structure suggests. Subscription and SaaS businesses typically layer in net new ARR, expansion revenue, and renewals, often at different payout rates for each category, then stack ramp schedules, draws, multi-product splits, and chargeback rules on top. A benchmark OTE figure omits all of that complexity; it all has to be built separately, deal type by deal type.
Accelerators deserve particular attention. Once a rep clears quota, the commission rate on the overage should increase, typically to 1.5x or 2x the standard rate per WorldatWork's data, and capping that accelerator is a decision that consistently costs companies their top performers. Whether to cap commission at all is a real design choice, not a default setting: caps protect the budget, but they demotivate exactly the reps a company can least afford to lose, so the tradeoff needs to be made explicitly rather than inherited from a template.
The stakes of getting this wrong are not abstract. A Gartner survey found that 90 percent of sellers report burnout when comp plans are poorly built, and 64 percent of sales professionals said they'd leave for a similar role elsewhere if the pay were better. The Alexander Group's 2024 Sales Compensation Trends Survey found 61 percent of companies planning to grow sales headcount, with total compensation costs projected to rise 5.3 percent, and the cost of getting the plan wrong is only going up. Keeping plans role-specific, SDR plans separate from AE plans, avoiding changes mid-year, and reviewing structure at least annually, are the guardrails that keep a benchmarked plan from drifting out of date before the next survey cycle even lands.
Why benchmarked plans break down at the calculation step and what accurate commission processing requires
None of the design work above matters if the payout math is wrong. A correctly benchmarked, correctly structured plan still produces bad outcomes if commission gets miscalculated at the point of payment: rep trust erodes, disputes pile up, and finance loses any real visibility into what comp is actually costing the business.
The scale of the exposure is bigger than most teams assume. Industry research puts the error rate in spreadsheets generally at 88 percent, and yet Gartner data shows more than 70 percent of companies still run commission calculations in spreadsheets. The downstream effect: commission errors affect an average of 8.8 percent of payouts annually. At any team beyond a handful of reps, that's not a rounding error, it's a material financial liability and a trust problem running in parallel.
Most of that error traces back to data that isn't contract-grade. CRM records need to match signed agreements exactly: term length, start date, booking classification, all of it. When a deal amount gets adjusted after the fact, when a stage gets reversed, when ownership changes hands mid-cycle, a spreadsheet-based process has no reliable way to catch the change and propagate it correctly into the next commission run. That's the actual failure point where a well-benchmarked, well-designed plan stops delivering what it promised: the arithmetic underneath it was never built to keep up with how deals actually move.